01 One operation, many columns
dplyr · across() · where()
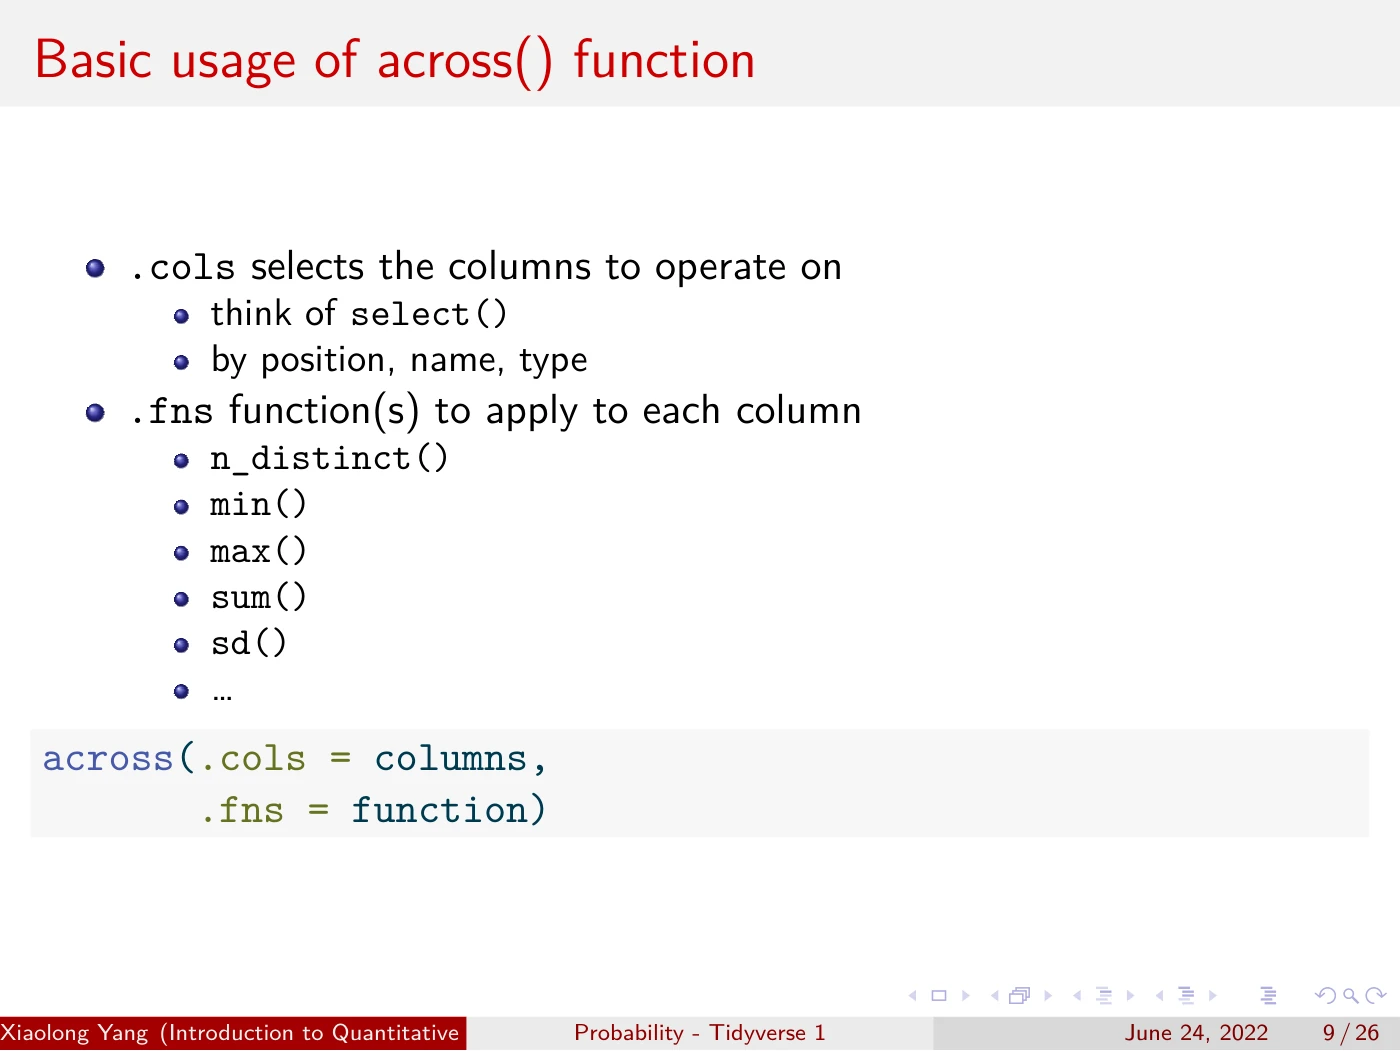
I started with repeated summaries of Florida voter data, then replaced them with across(). Same calculation; less repetition.
Learning statistical programming deeply through teaching.
Quantitative Social Science · University of Tokyo · Summer 2022
Course assistant for Kosuke Imai. I taught tidyverse lectures for social science students.
dplyr · across() · where()
I started with repeated summaries of Florida voter data, then replaced them with across(). Same calculation; less repetition.
Functions · arguments · code style
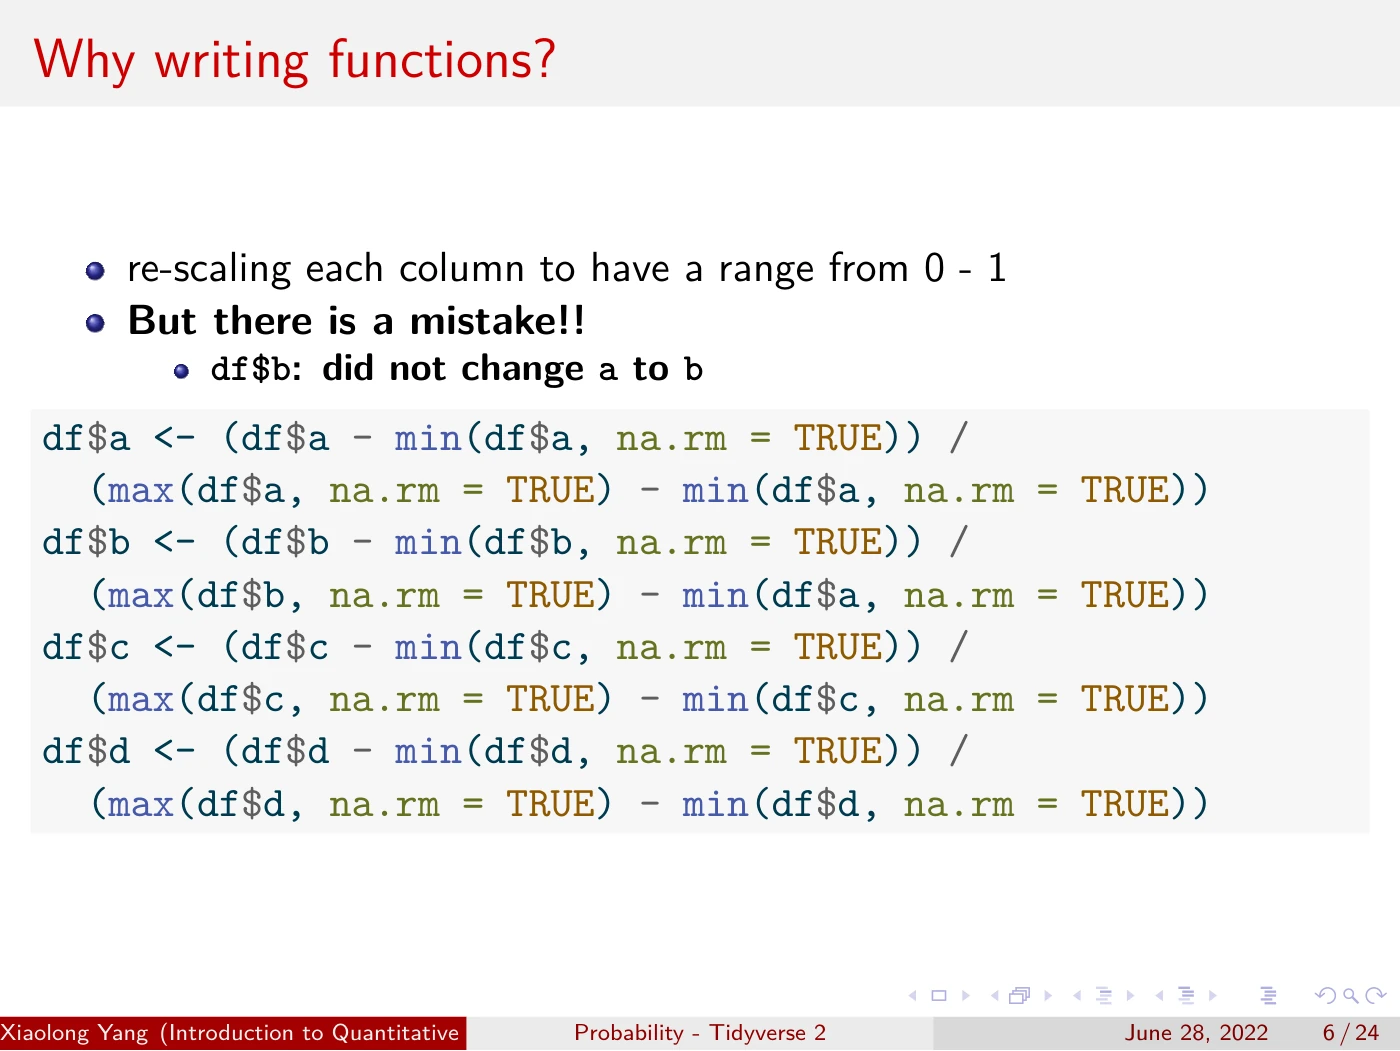
A copy-paste error made the case for functions. We then built one in three steps: name, inputs, body.
Vectors · lists · data frames
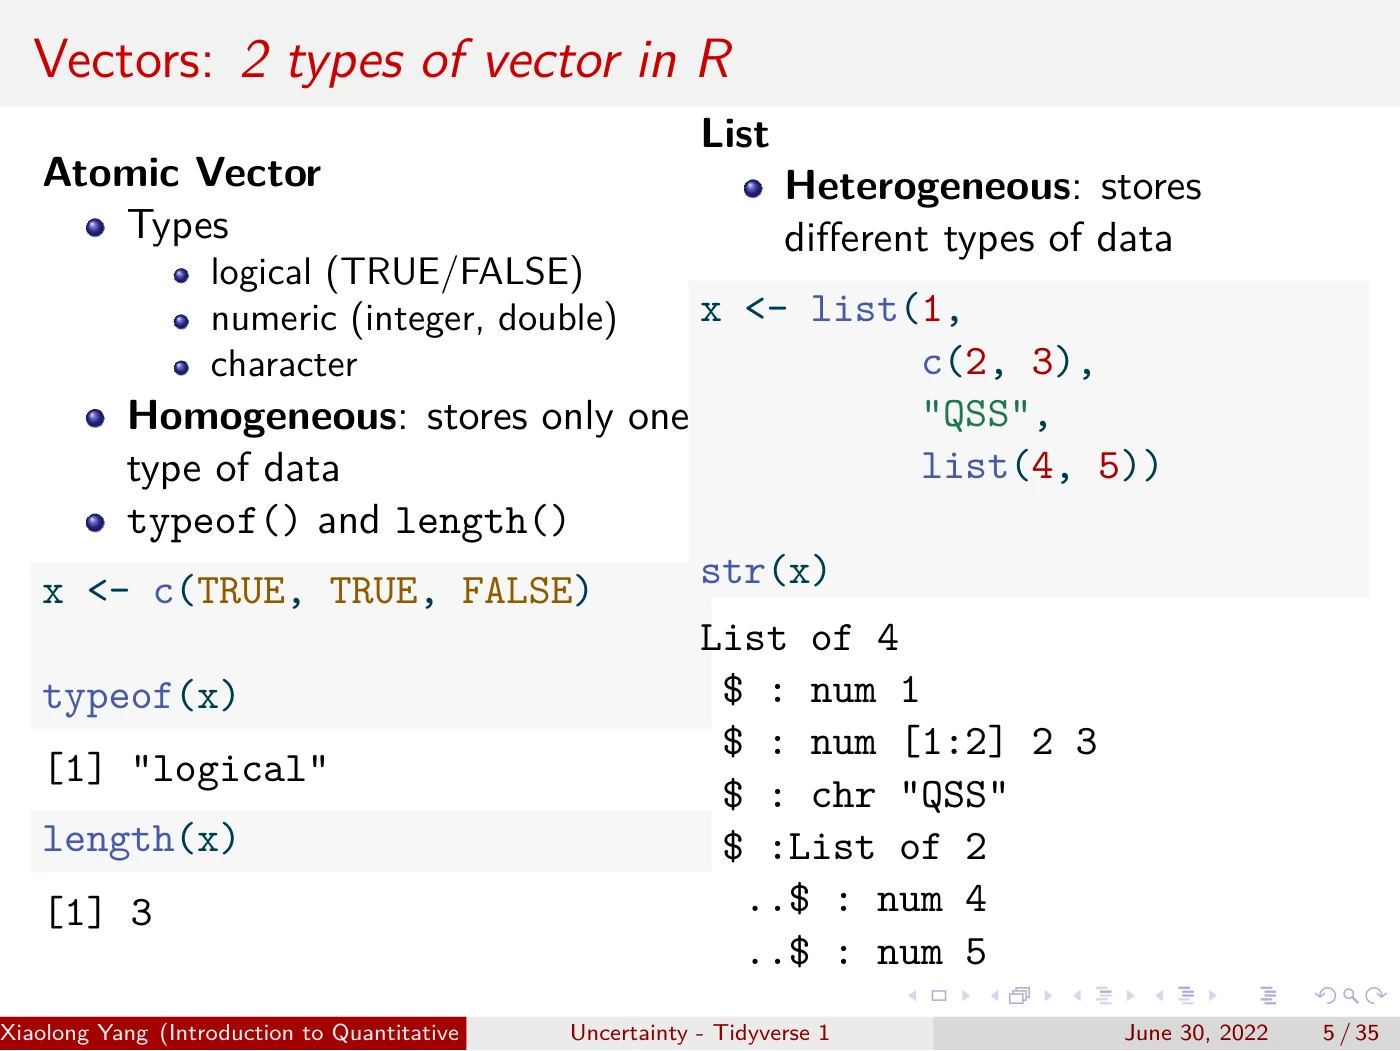
I compared atomic vectors and lists side by side, using code and its output to connect data types to their structure.
For loops · functionals · purrr
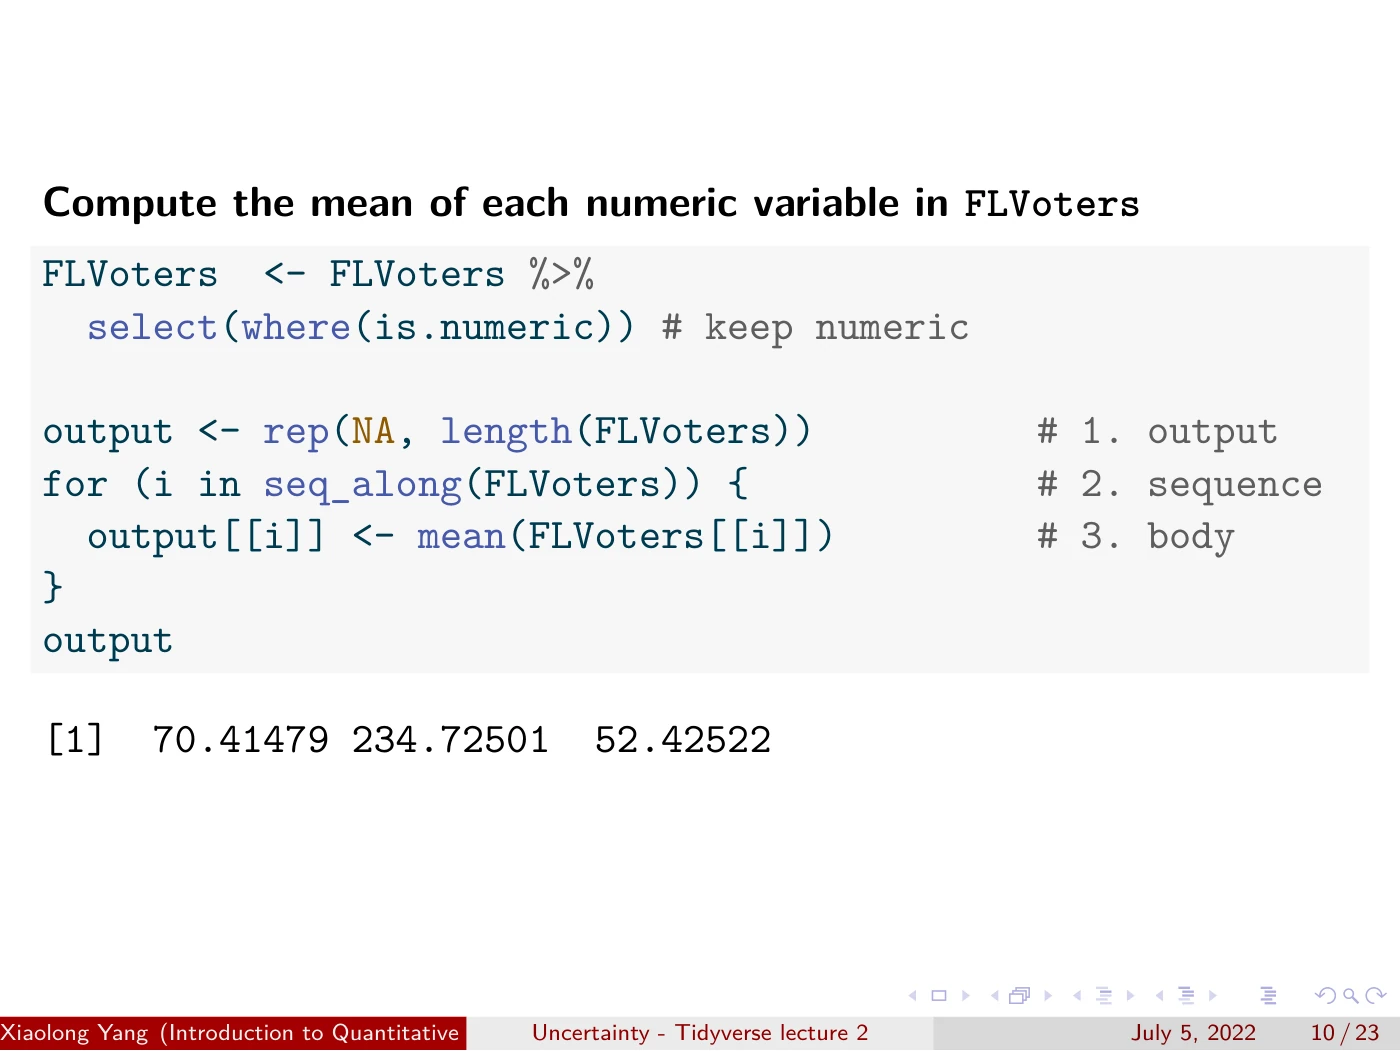
I unpacked a loop into output, sequence, and body. We then generalized column means to other summaries by passing a function as an argument.
ggplot2 · intervals · facets
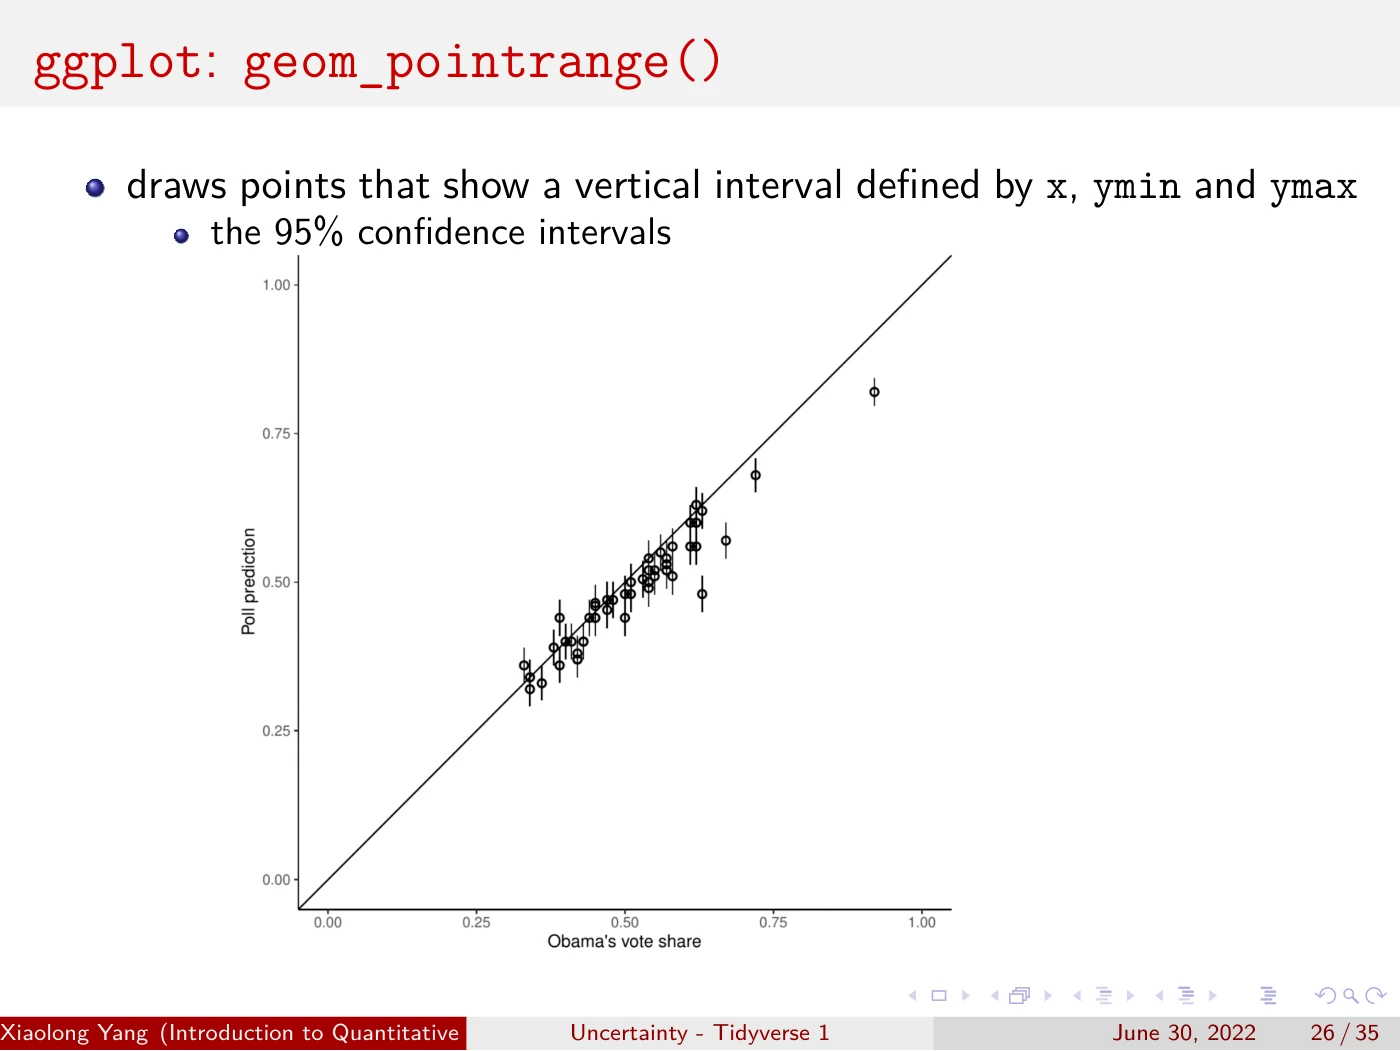
I paired plotting syntax with the figure it produces: vote-share predictions and 95% confidence intervals, followed by faceting examples.
R Markdown · LaTeX · Bayes’ rule
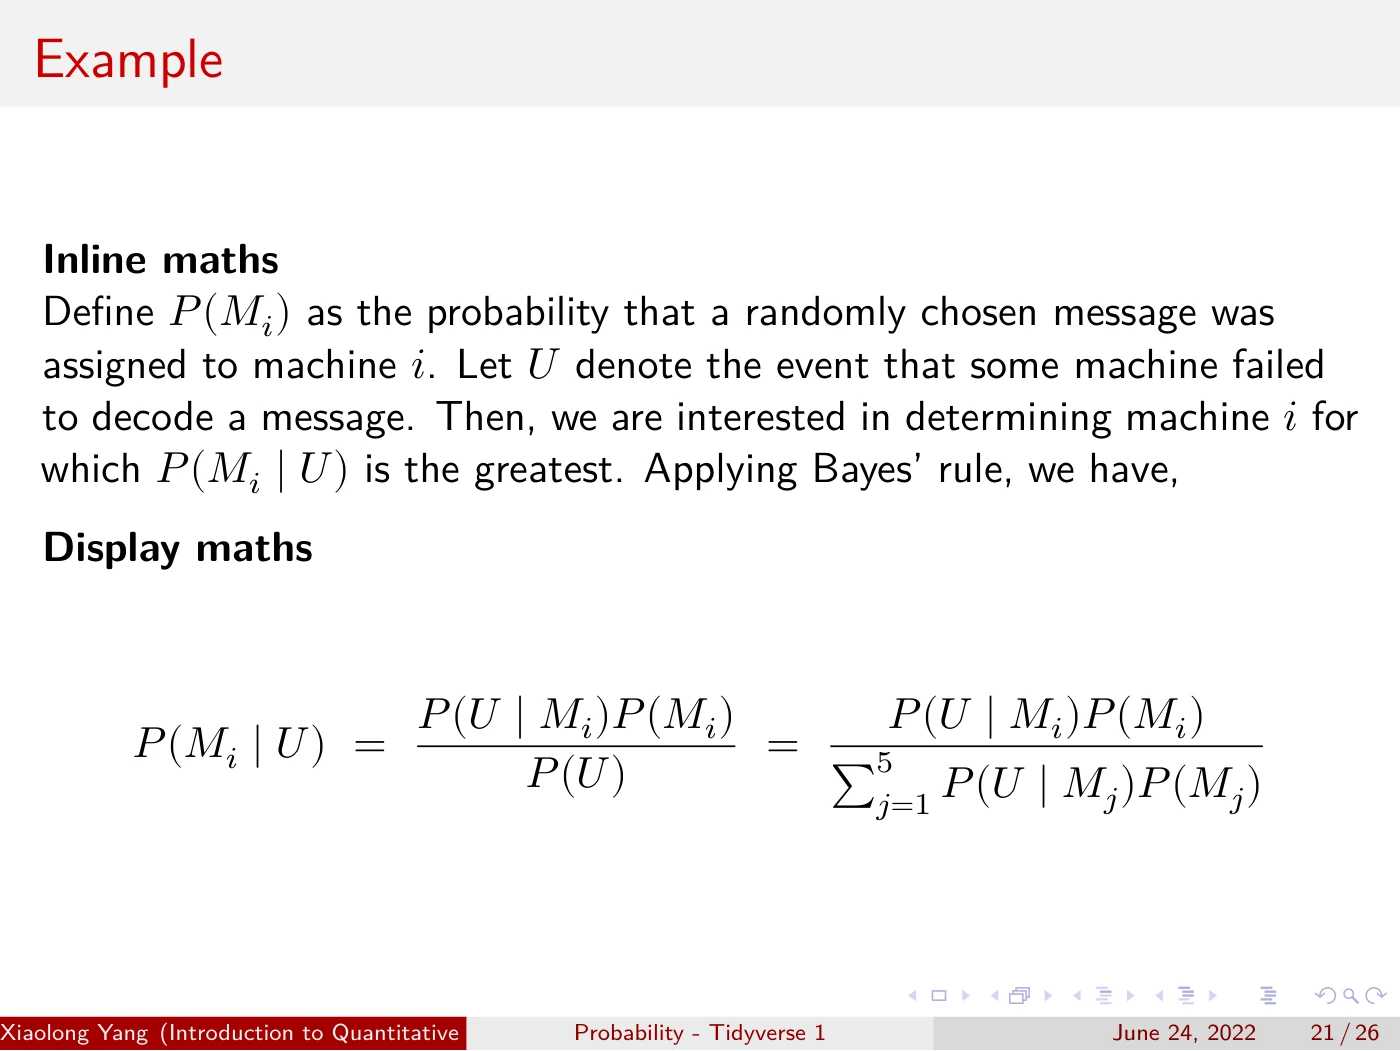
Using the Enigma decoding problem, I showed mathematical source and rendered notation, then how prose and code share one document.
The lectures led into in-class QSS assignments: Enigma decoding, women in China, and the file-drawer problem. The sequence was concrete example → reusable idea → application.
Selected from my Probability and Uncertainty decks in our teaching team’s open materials. Examples draw on QSS, R for Data Science, and Advanced R.
Grateful to Kosuke Imai and Connor Jerzak for opportunities to learn and teach.